Warning You're reading an old version (v5.0) of this documentation.
If you want up-to-date information, please have a look at master.
Synthetic Data
The section shows some synthetic studies made using MARE2DEM. Synthetic forward studies can be highly useful for determining whether or not a given structure generates a detectable MT or CSEM response and for seeking out the optimal frequency range for maximizing the anomalous signals. Once you establish whether or not a structure can generate a detectable EM response signal, the next test is to carry out synthetic inversion studies to see if the data can resolve the structure, since non-uniqueness in EM inversion means data sensitivity does not necessarily translate into data resolution. Synthetic inversion studies can also be used to optimize receiver and transmitter layouts, frequency ranges, impacts of various relative and absolute noise levels, etc.
Crosswell EM
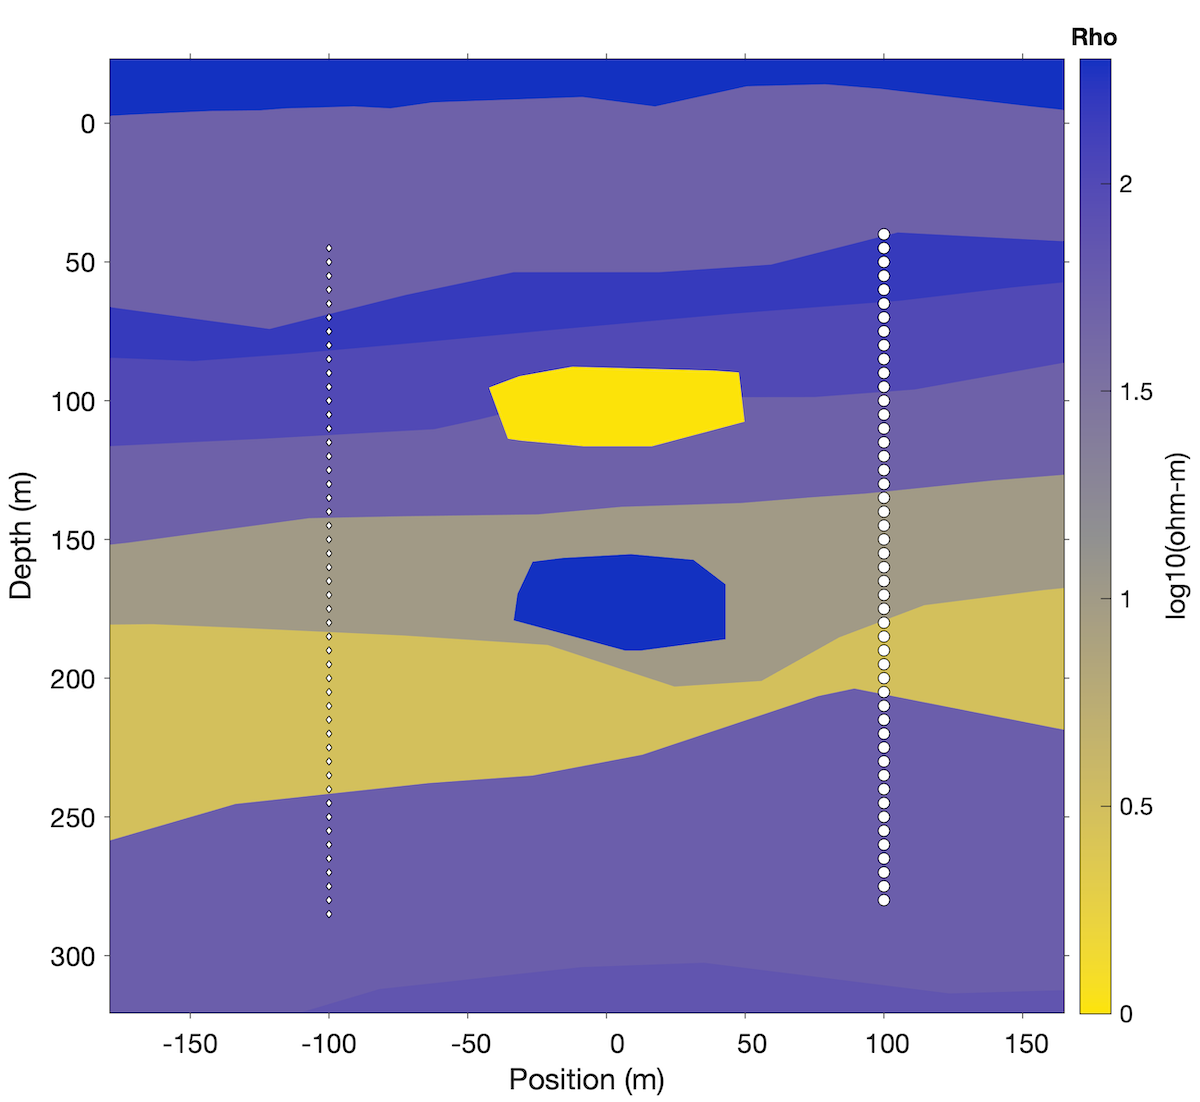
Fig. 18 Forward model used for crosswell EM study. 400 Hz amplitude and phase data were generated for 49 vertical magnetic dipole transmitters (circles) with 49 vertical magnetic dipole receivers (diamonds). 1% noise was added to the forward responses to create synthetic data for inversion. Note the topography and undulating model structure shown here is the actual polygonal model layering precisely modeled in MARE2DEM using adpative finite element meshes.
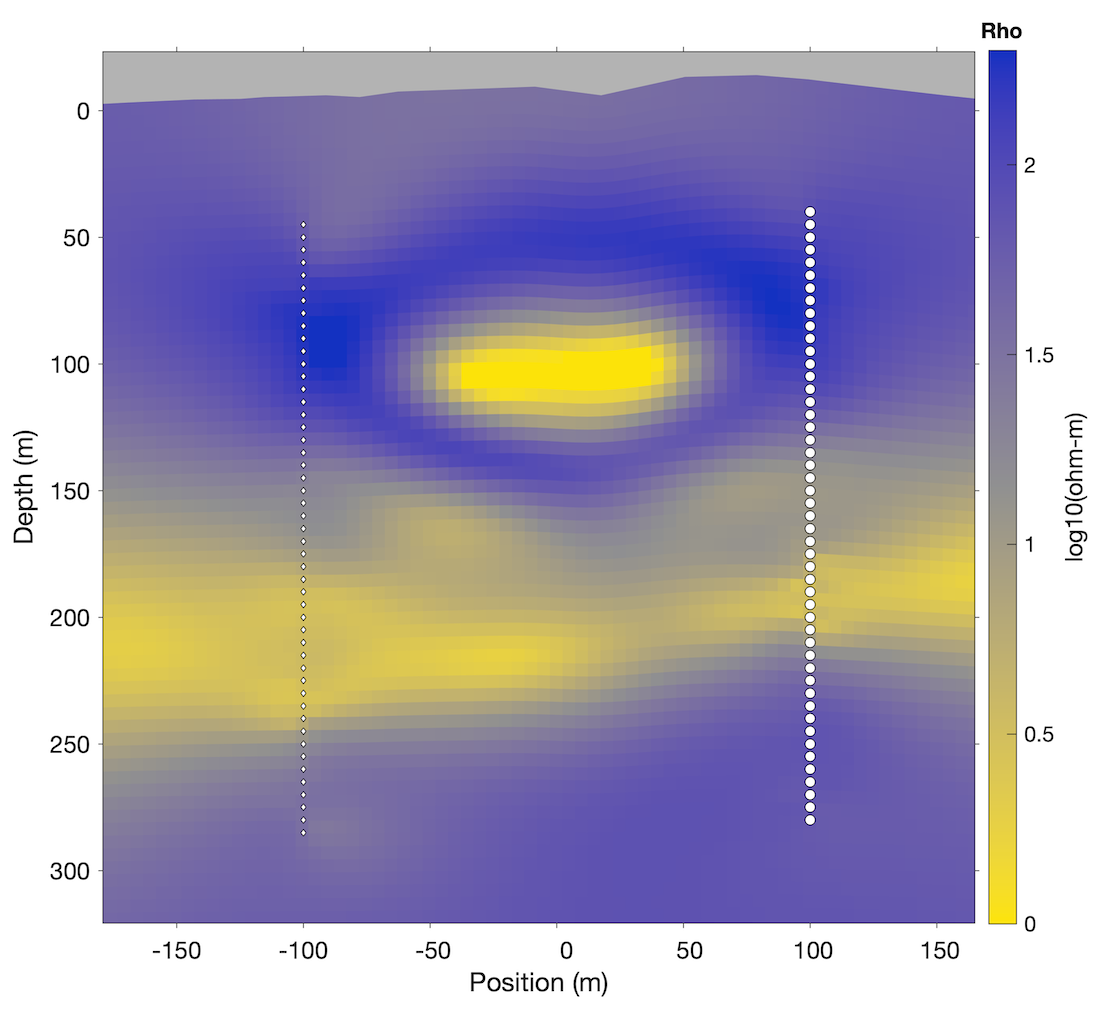
Fig. 19 Inversion fitting the data to RMS 1.0. Note how the conductive layering and prism body are well recovered but the resistive body is not recovered, as expected for inductive magnetic transmitters and receivers.
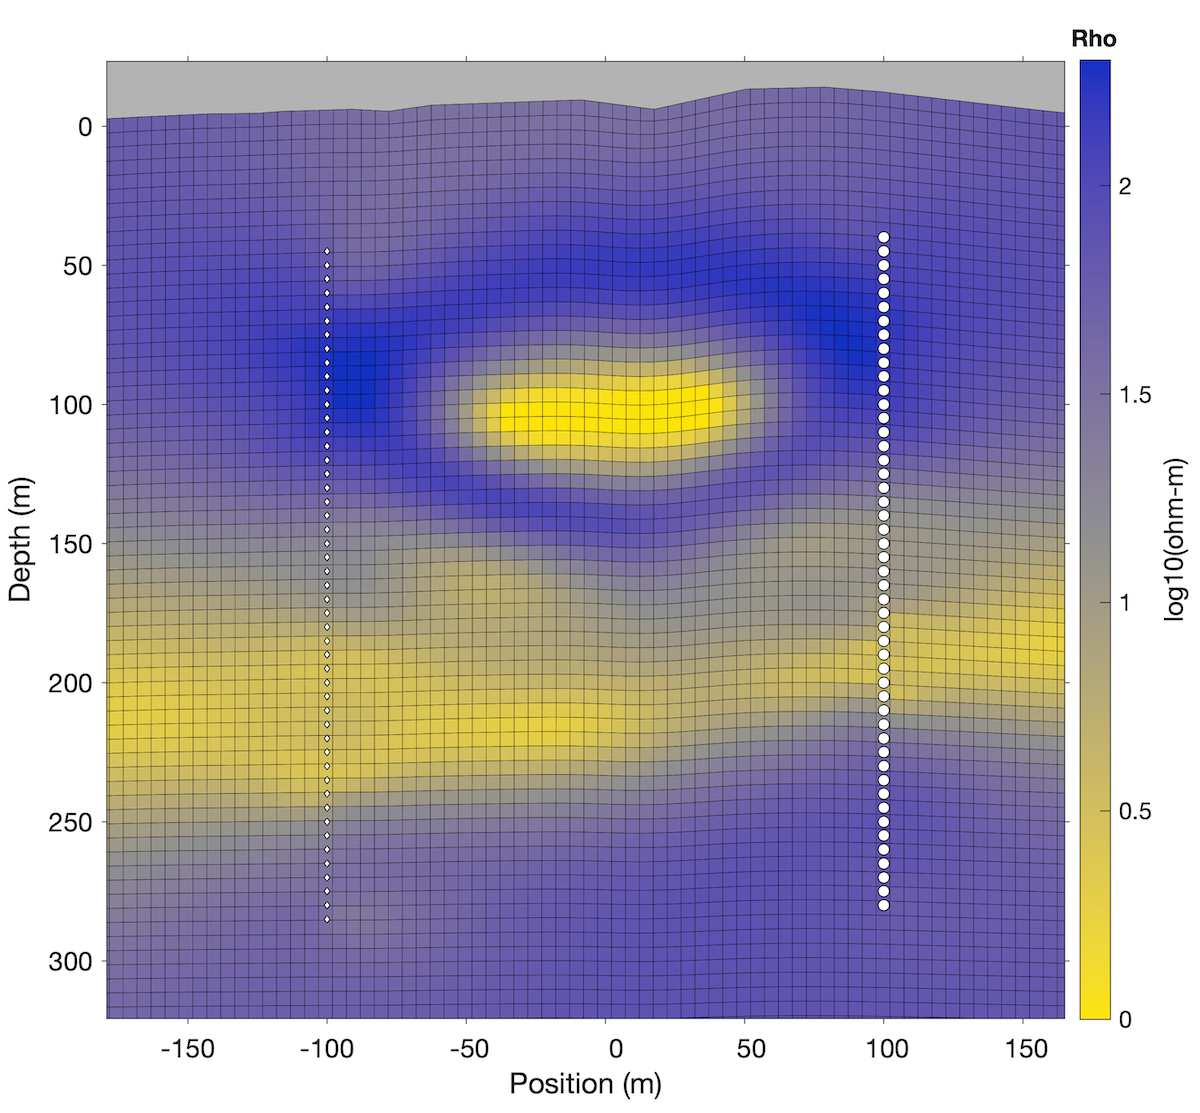
Fig. 20 Inversion model now shown with the quadrilateral free parameter grid boundaries outlined in black.
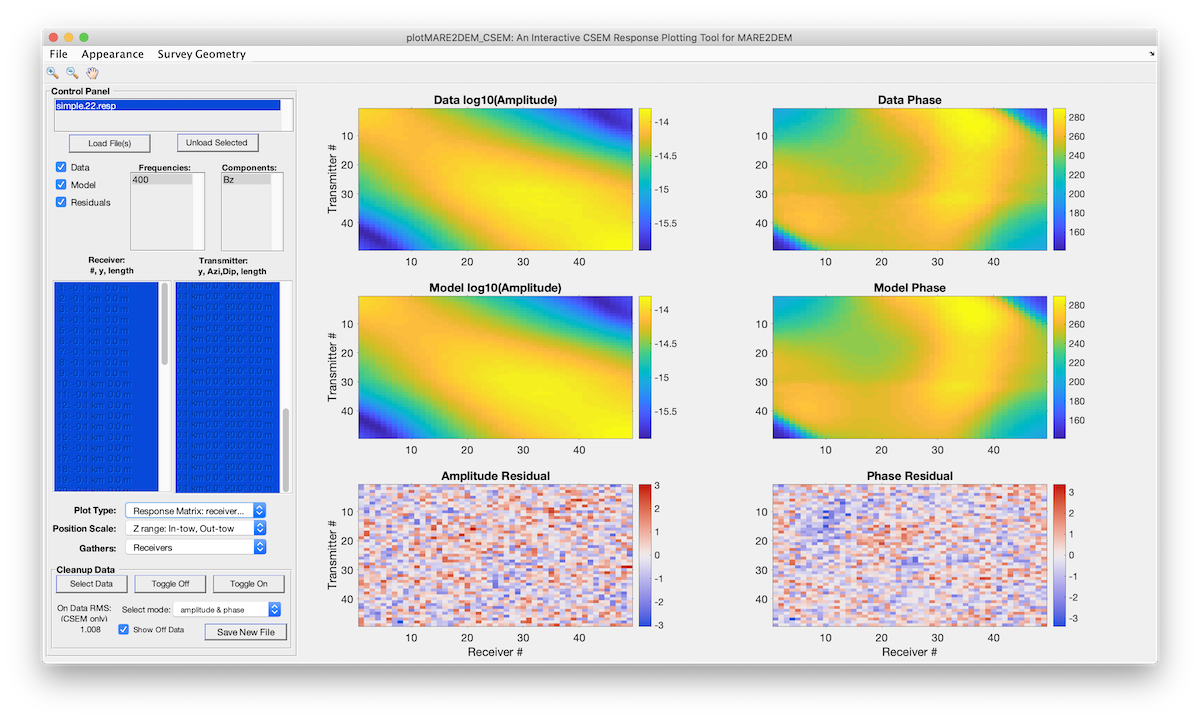
Fig. 21 Synthetic crosswell EM data and model fits shown in matrix form.
Subglacial MT Imaging of Groundwater
Modified from: Key, K., & Siegfried, M. R. (2017), The feasibility of imaging subglacial hydrology beneath ice streams with ground-based electromagnetics. Journal of Glaciology, 331, 1–17. DOI: 10.1017/jog.2017.36. This conceptual model study paper helped lead to funding for the SALSA EM survey in Antarctica.
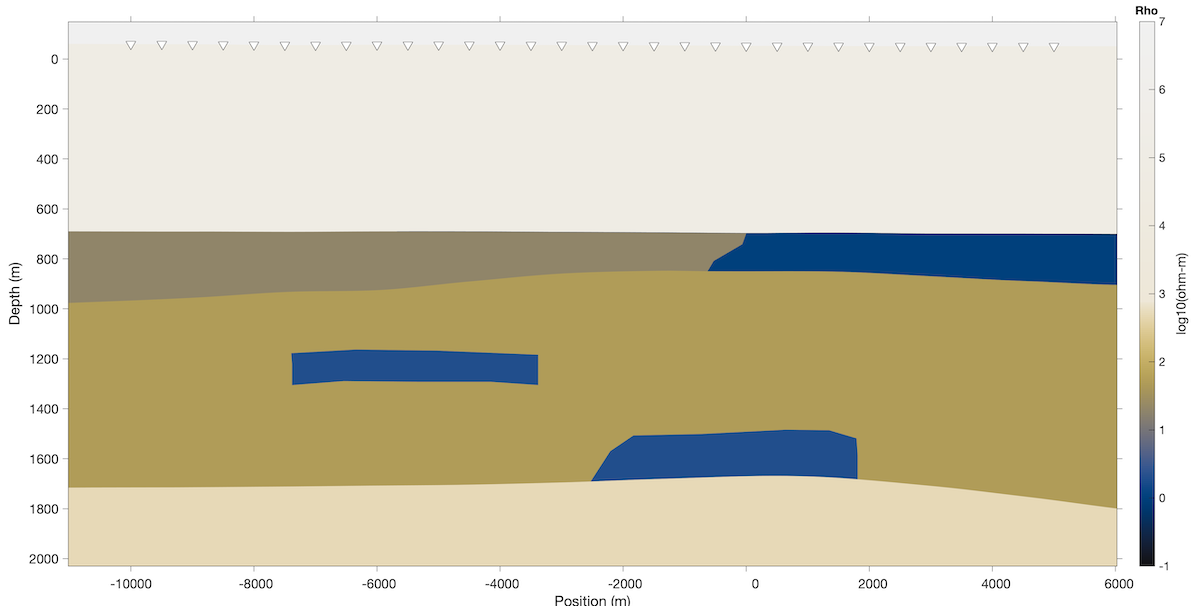
Fig. 22 Resistivity forward model for subglacial groundwater at the grounding line of the Whillans Ice Stream, West Antarctica, where it becomes the Ross Ice Shelf. Blue regions show seawater saturated sediments and isolated saline aquifers.
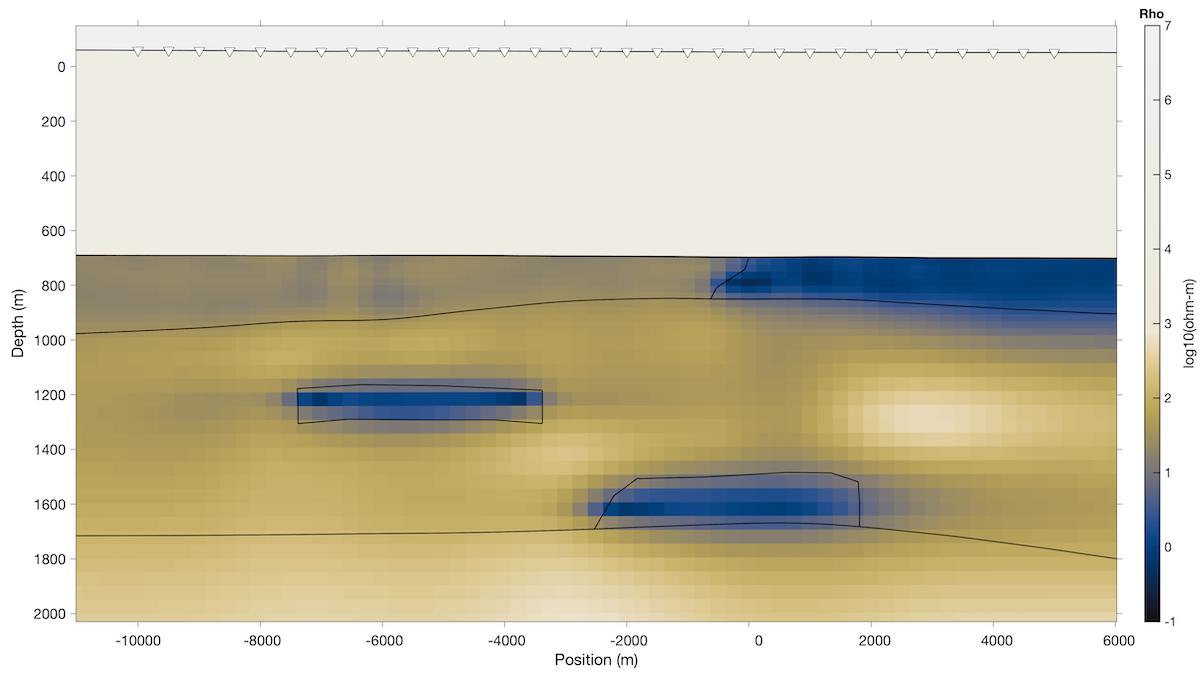
Fig. 23 MARE2DEM inversion of synthetic MT data generated for the grounding zone model above. The ice layer (100,000 ohm-m) was held as fixed structure with known resistivity. Black lines show the structural boundaries from the true model. The dark conductive features are well resolved by the MT array, showing how MT data can be useful for mapping subglacial groundwater and brines beneath ~700 m of ice.